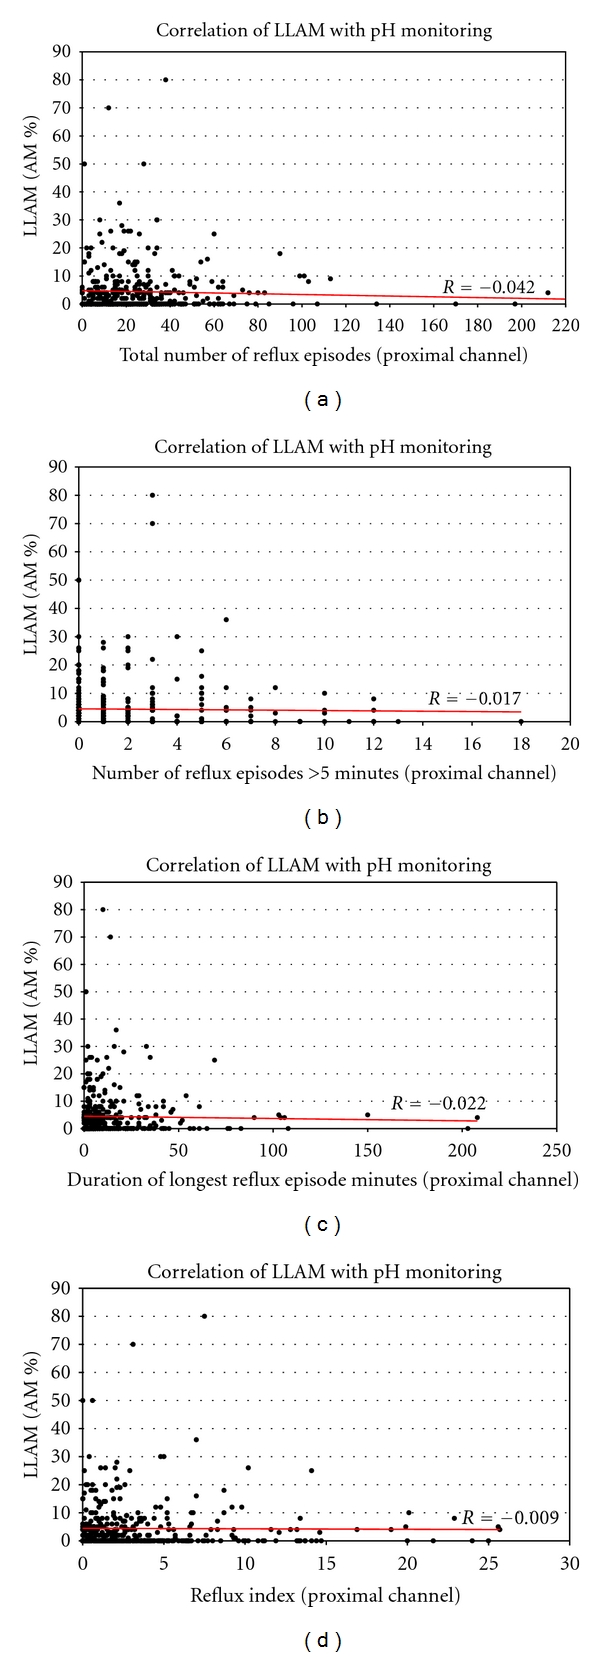
Figure 2.

Scatter plots of parameters from the proximal channel of a double-channel 24 hr pH probe in the esophagus versus LLAM count (in % of 300 AMs; n = 448). (a) Total number of reflux episodes: no correlation with the percentage of fat containing AMs (LLAMs/%AMs) in the regression analysis (r = −0.042). (b) Number of reflux episodes, lasting longer than five minutes: no correlation with the percentage of fat containing AM (LLAMs/%AMs) in the regression analysis (r = −0.017). (c) Duration (minutes) of the longest reflux episode: no correlation with the percentage of fat containing AMs (LLAMs/%AMs) in the regression analysis (r = −0.022). (d) Reflux Index (percentage of time pH below 4): no correlation with the percentage of fat containing AMs (LLAMs/%AMs) in the regression analysis (r = −0.009).
