Figure 3.
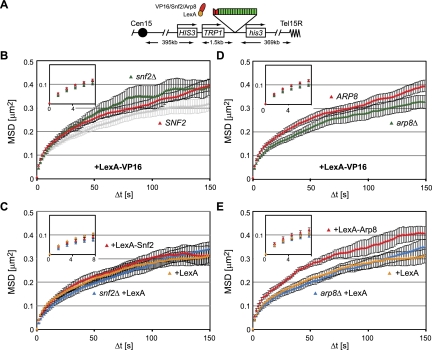
Snf2 and Arp8 have differential effects on chromatin movement. (A) Map of the HIS3 locus with lacO-binding sites (green) and LexA-binding sites (red). (B) MSD plots from time-lapse imaging of the HIS3 locus in SNF2 (GA3441 [red]) and snf2Δ (GA3444 [green]) cells expressing LexA-VP16, and SNF2 (GA3441) cells expressing LexA alone (light gray) performed and analyzed as in Figure 2, A and B. (C) SNF2 cells (GA3441) expressing either LexA (yellow) or LexA-Snf2 (red) along with snf2Δ (GA3444 [blue]) expressing LexA alone. (D) MSD plots obtained as in Figure 2, A and B, showing ARP8 (GA3441 [red]) and arp8Δ (GA6447 [green]) expressing LexA-VP16 (plasmid no. 2007). (E) MSD analysis of ARP8 cells (GA3441) expressing either LexA (yellow) or LexA-Arp8 (red) along with arp8Δ cells (GA6447) expressing LexA alone (blue).

