
Figure 5.
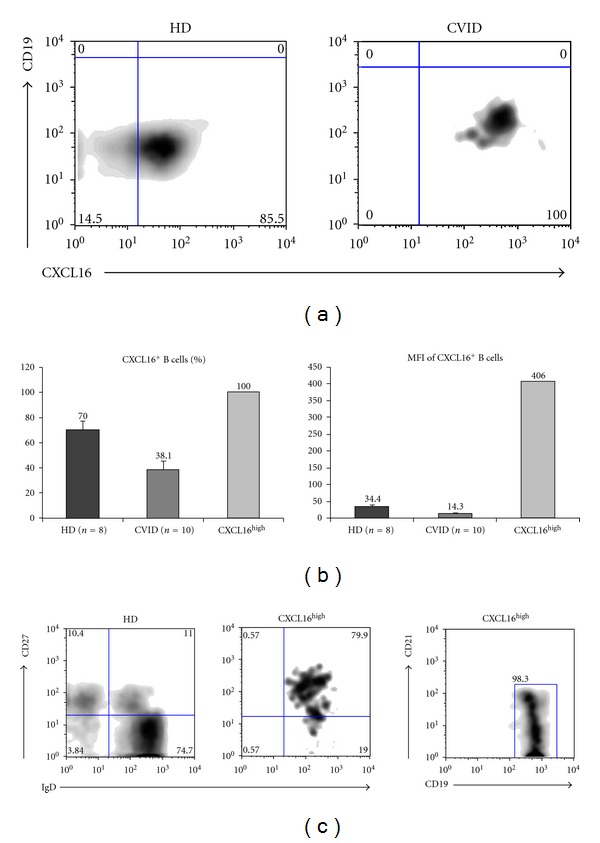
Identification of CXCL16high B cells. (a) Elevated expression of CXCL16 on CVID B cells when compared to healthy control. (b) Elevated expression of CXCL16 on CVID B cells when compared to the mean expression levels of CVID patients and healthy controls both as percentage (left panel) and mean fluorescence intensity (right panel). (c) Characterization of maturational status of CXCL16high B cells by expression of CD27, IgD, and CD19, CD21. Graph bars show standard error (SE).