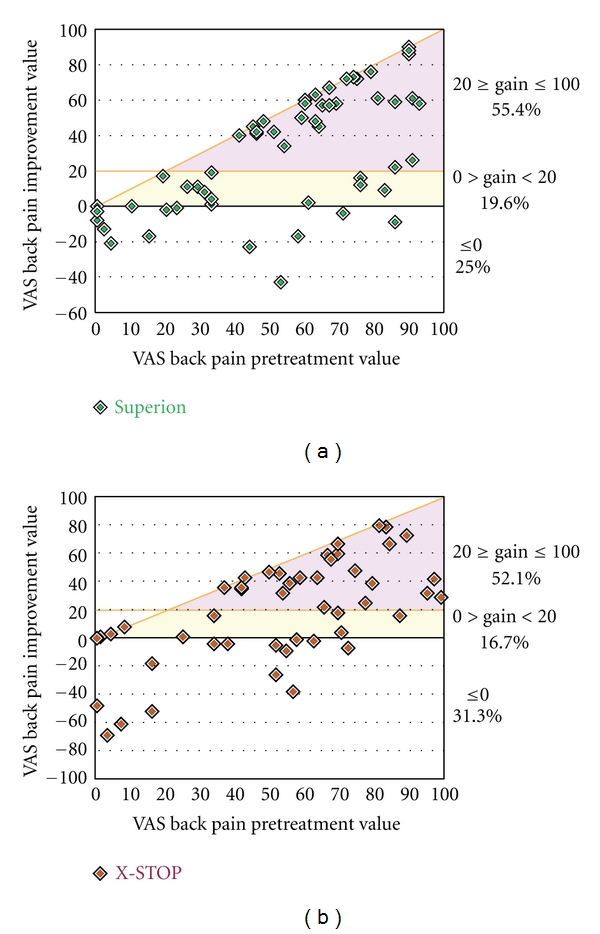
Figure 10.

Relationship of pretreatment axial pain severity with absolute axial pain improvement at 6 months. (a) Superion, (b) X-STOP. Data are reported in mm and include values from pretreatment and from the final subject followup visit at or beyond 3 months. The horizontal line represents the absolute change threshold (20 mm) for clinical success. Subjects on or above this line achieved clinical success. The diagonal line represents the maximum achievable absolute improvement based on the pretreatment value.
