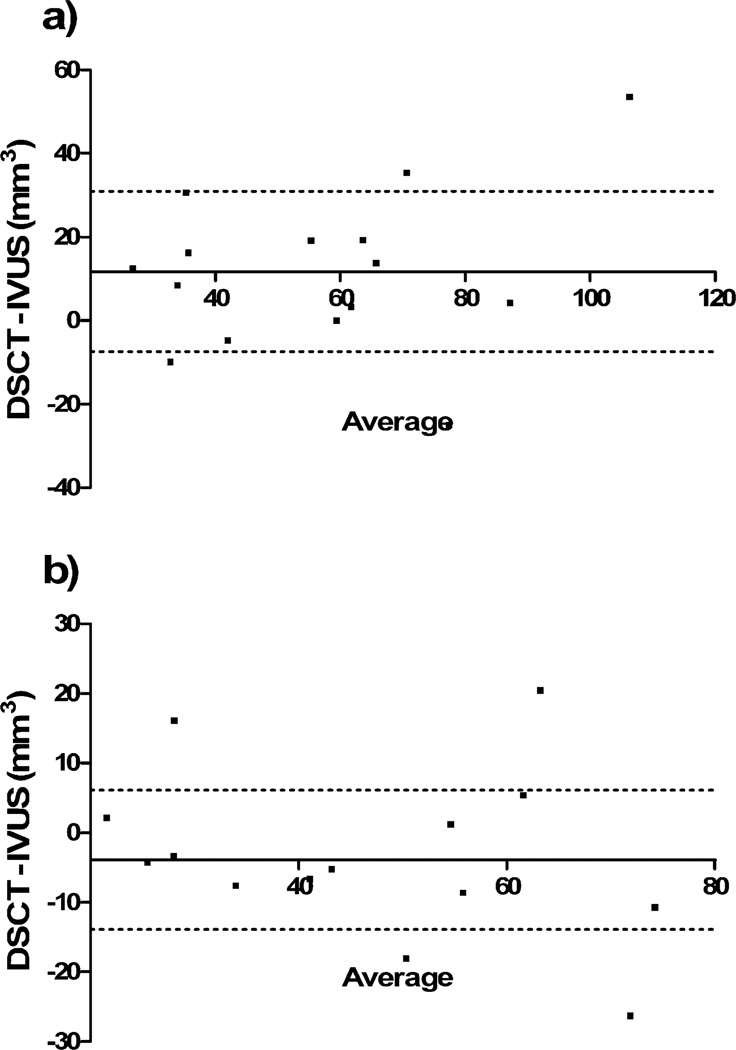
Fig. 3.
Bland-Altman analysis comparing total plaque volumes as obtained with DSCT and IVUS. Data are shown for visual adjustment of color maps to plaque (a) and evaluation based on HU thresholds (b). The X axis denotes the average of DSCT and IVUS; the point of intersection with the Y axis indicates the bias of DSCT. Dotted lines show 1 standard deviation of the bias

