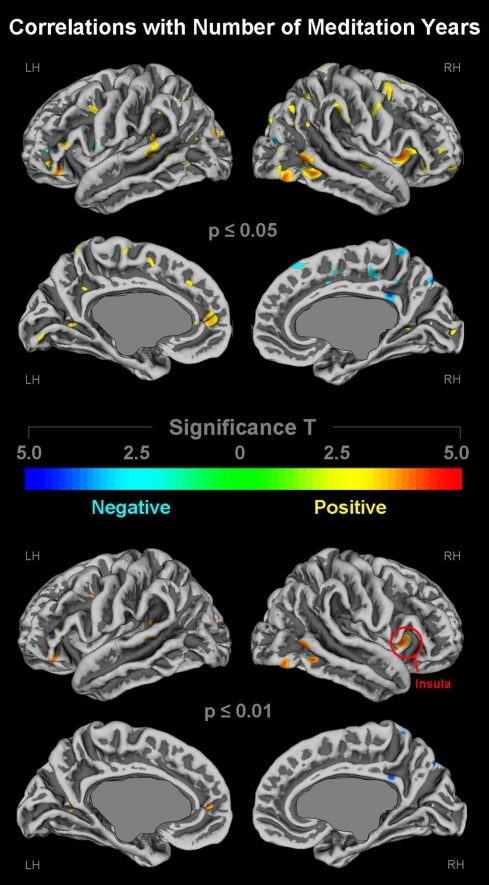
Figure 3.
Links between cortical gyrification and number of meditation years. Shown are correlations at p ≤ 0.05 (upper panel) and p ≤ 0.01 (lower panel), uncorrected for multiple comparisons. The color bar encodes significance (T). Areas with positive correlations (i.e., more meditation years link with more gyrification) are depicted in yellow/orange; negative correlations (i.e., more meditation years link with less gyrification) are depicted in cyan. Callosal, subcallosal, and midbrain regions have been excluded on the medial surface maps. The red circle indicates the global maximum. LH, left hemisphere; RH, right hemisphere.

