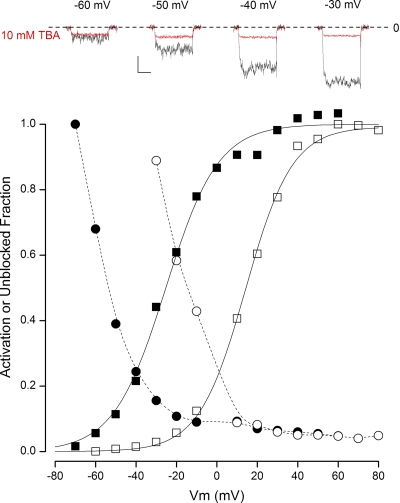
Figure 2.
Open-state block of BK channels by TBA in K+ solutions. (Top insets) Time course of raw BK channel currents recorded in 100 µM Ca2+ in the absence (black) and presence (red) of 10 mM TBA at the potentials indicated. Calibration: 0.4 nA, 50 msec. The zero-current level is indicated by the dashed line. (Main) Voltage dependence of BK channel activation in 100 µM Ca2+ (■) and in 10 µM Ca2+ (□). Also shown is the voltage dependence of the fraction of channels not blocked by 10 mM TBA in 100 µM Ca2+ (•) and in 10 µM Ca2+ (○). Solid lines, fits of the Boltzmann equation to the data; dashed lines, spline fits to the data.

