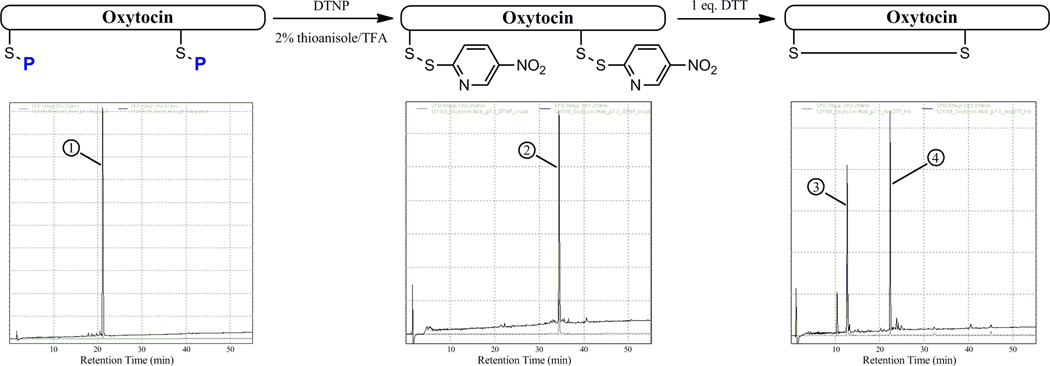
Figure 4.
Stepwise HPLC comparison of the deprotective profile of oxytocin systems 7–10 (bis-Acm system used as example). Chromatogram on left shows bis-Acm-protected oxytocin peptide (1). Middle chromatogram shows crude HPLC profile following treatment with DTNP/thioanisole of bis-Npys oxytocin intermediate (2). Chromatogram on right is crude HPLC profile following treatment with 1 eq. DTT, showing peaks for free 5-Npys moiety (3) and cyclized native oxytocin (4).

