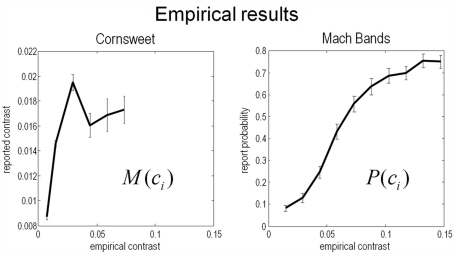
Figure 11.
experimental results. This figure shows the results of the empirical psychophysical study for the Cornsweet illusion (left panel) and the Mach band illusion (Right panel). Both report the average effect over subjects and the SE (bars). The Cornsweet illusion is measured in terms of the subjective contrast level (quantified in terms of subjective equivalence using psychometric functions). The Mach band illusion is quantified in terms of probability that the illusion is reported to be present. Both results are shown as functions of empirical (Weber) stimulus contrast levels. We have used the same range for both graphs so that the dependency on contrast levels can be compared. The key thing to note here is that the Cornsweet illusion peaks before the Mach band illusion (vertical line).

