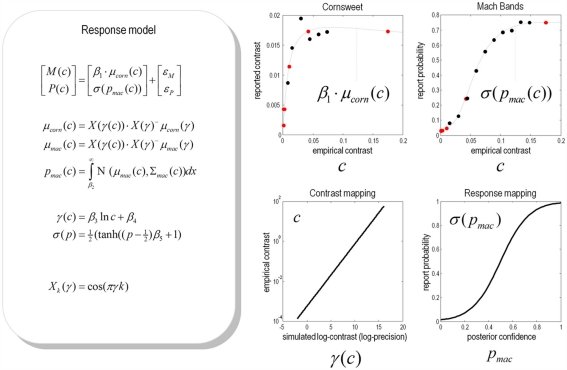
Figure 12.
Predicted and experimental results. Theoretical predictions of the empirical results reported in the previous figure: These predictions are based upon a response model that maps from the conditional expectations and precisions in the simulations to the behavioural responses of subjects. This mapping rests on some unknown parameters or coefficients βi:i = 1, …, 5 that control the relationship between the simulated γ(c) and empirical contrast levels c used for stimuli and the relationship between the probabilities of reporting a Mach band σ(pmac(c)) and the conditional probability that it exceeds some threshold pmac(c) at contrast level c. These relationships form the basis of a response model, whose equations are provided in the left panel (for simplicity, we have omitted the expressions for conditional variance of the Mach band contrast). Given empirical responses for the mean Cornsweet effect M(c) and probability of reporting a Mach band P(c), the coefficients βi can be estimated under the assumption of additive prediction errors ε. The predicted responses following this estimation are shown in the graphs on the right hand side. The upper panels show the empirical data superimposed upon conditional predictions from the model. The gray lines are the predicted psychometric functions, μcorn(c) and σ(pmac(c)). The red dots correspond to the predictions at levels of contrast used in the simulations (as shown in Figure 9), while the black dots correspond to the empirical responses: M(c) and P(c). The lower left panel show the relationship between the empirical and simulated contrast levels (as a semi-log plot of the empirical contrast against the log-precision of sensory noise). The lower right panel shows the relationship between the probability of reporting a Mach band is present and the underlying conditional probability that it is above threshold.

