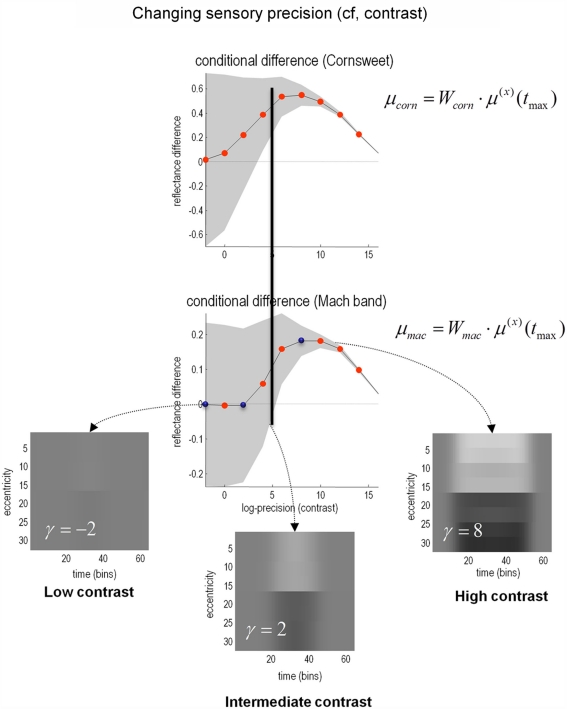
Figure 8.
The effect of contrast. In the results presented here the precision of the sensory data was used as a proxy for stimulus contrast. As precision increases, the strength of both the Cornsweet and Mach effects increases until, at very high levels of precision (contrast) the true luminance profile is perceived and the illusory percepts fade. Crucially, the Mach bands appear at higher levels of contrast than the Cornsweet illusion. The inserts in the lower panels show the inferred reflectance is at different levels of contrast (indicated by the blue dots in the lower graph). The prediction errors associated with the processing of stimuli at these three levels are shown in the next figure. Please see main text for further details.

