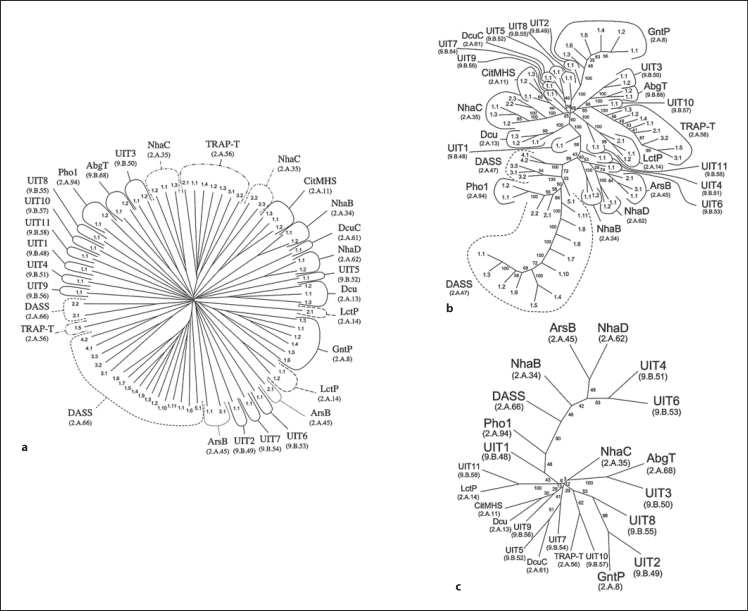
Fig. 4.
Phylogenetic (Fitch) trees for the IT superfamily using the proteins in TCDB. Three different methods of tree construction were used: ClustalX-based neighbor-joining (a), the BLAST-derived SFT1 approach showing all IT superfamily members (b), and the SFT2 approach showing all IT superfamily families (c). a, b Numbers indicate the protein TC#s (last two digits of the complete TC#). c Family abbreviations are presented with TC family numbers in parentheses. b, c Small numbers adjacent to the branches represent the ‘bootstrap’ values, indicating the reliability of the branching order. See TCDB for protein identification.

