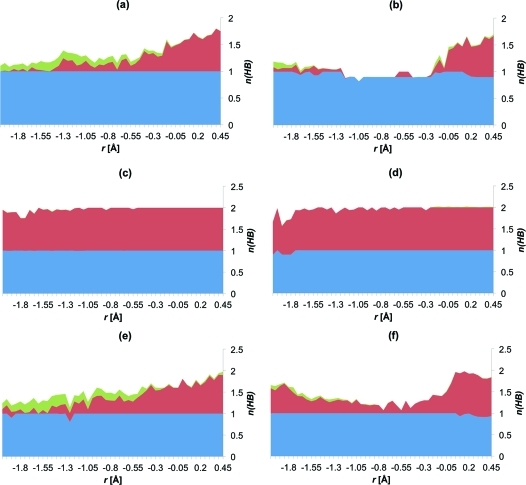
Figure 6.
Hydrogen bonding to the epoxide oxygen atom during nucleophilic attack at (a) C(1) of t-SO, (b) C(2) of t-SO, (c) C(1) of t-DPPO(1), (d) C(2) of t-DPPO(1), (e) C(1) of t-DPPO(2), and (f) C(2) of t-DPPO(2). The height of the graph corresponds to the total number of hydrogen bonds to the epoxide oxygen, n(HB), at each value of r, during the extended AM1/CHARMM22 umbrella sampling MD simulations, averaged over all profiles. The contributions from Tyr381, Tyr465, and Trp334 are colored blue, red, and green, respectively. The reactant complex is at r = −2.0 Å; the alkyl–enzyme intermediate is at r = 0.5 Å, and the transition state is around r = −0.2 Å (see the text for the definition of r).

