
Figure 1.
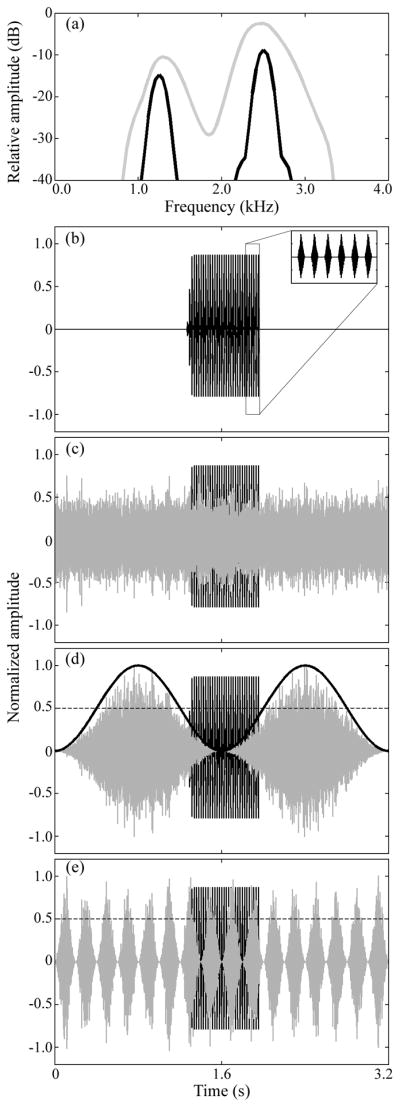
(a) Frequency spectrum of the target signal (black line) and the chorus-shaped maskers (gray line) calculated with 256-point Blackmann-Harris windows. Waveforms of 3.2-s segments of the target signal alone (b), and in the presence of maskers representing the non-fluctuating control treatment (c), or experimental treatments with maskers that fluctuated with sinusoidal modulation at rates of 0.625 Hz (d) and 5 Hz (e). Inset in (b) shows six pulses of the target signal. The solid black line in (d) depicts the sine wave used to modulate the masker. The dashed lines in (d) and (e) serve to illustrate the values at which the amplitude of the fluctuating maskers reaches 50% of the maximum amplitude; this line marks the 6-dB down-points used to measure the maximum number of consecutive pulses falling within dips of fluctuating maskers.