Figure 2.
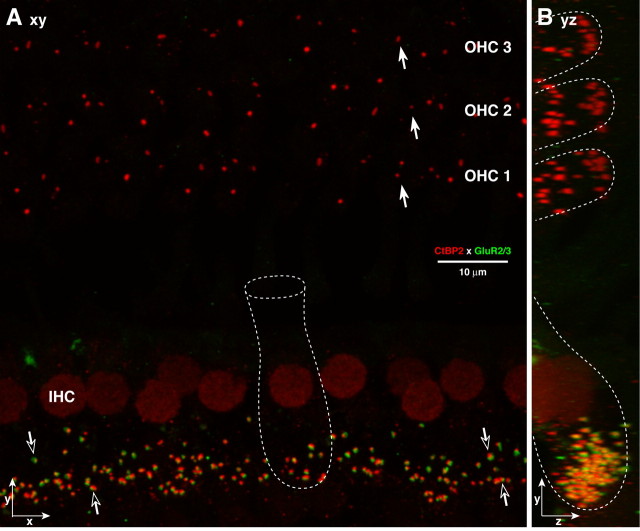
Afferent synapses on IHCs and OHCs are seen by immunostaining presynaptic ribbons with anti-CtBP2 (red) and postsynaptic densities with anti-GluR2/3 (green). In the IHC area, most synapses include closely apposed red and green puncta (open arrows), and IHC nuclei are also weakly immunopositive for CtBP2. In the OHC area, only CtBP2-positive puncta are seen (filled arrows). A, An xy projection of a confocal z-stack through the synaptic regions of 12 IHCs and numerous OHCs from the 8 kHz region. B, a yz projection of the same z-stack. Outlines (approximate) of individual hair cells are shown by dotted white lines in A and B.

