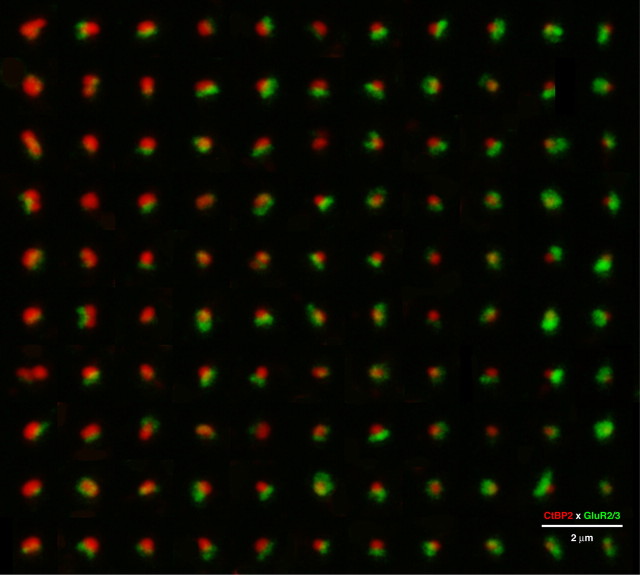
Figure 3.
The opposing size gradients of presynaptic and postsynaptic elements are seen by arraying images of all the afferent synapses from five adjacent inner hair cells in exact descending order of ribbon volume, defined using a criterion brightness of 50 (of 256) in the red channel. Larger ribbons (top left) are associated with small AMPAR patches, and small ribbons (bottom right) are associated with large AMPAR patches. Each component of this composite is an xy projection of a 1.5 μm cube of voxel space centered on a different ribbon. Each ribbon from the z-stack is shown exactly once: for some thumbnails, off-center (nearby) ribbons have been erased for clarity. For display, the image array was resampled (bicubic) in Photoshop to minimize pixelization: quantification was always performed on raw image stacks. These data were obtained from the 16 kHz region.

