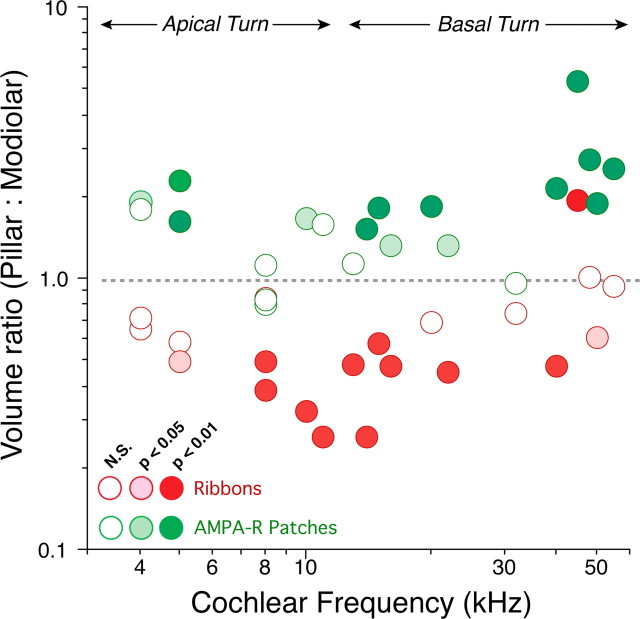
Figure 6.
Pillar/modiolar gradient of synaptic morphologies on the sensory cell at different cochlear locations, from apical (low-frequency) to basal (high-frequency) turns. Pooled data from Figure 5 are replotted here to show each cochlear region analyzed. Each confocal z-stack produces two data points: one (red) for the ratio between the mean ribbon size on pillar/apical versus modiolar/basal zones of the cell, and one (green) for the ratio between the mean size of AMPAR patches on the two sides of the cell. Fill color indicates the level of statistical significance (unpaired Student's t test comparing the volumes from pillar/apical versus modiolar/basal sides; see key). Approximate extents of the apical and basal turns of the cochlear spiral are indicated. Further technical details can be found in Materials and Methods.

