
Figure 2:
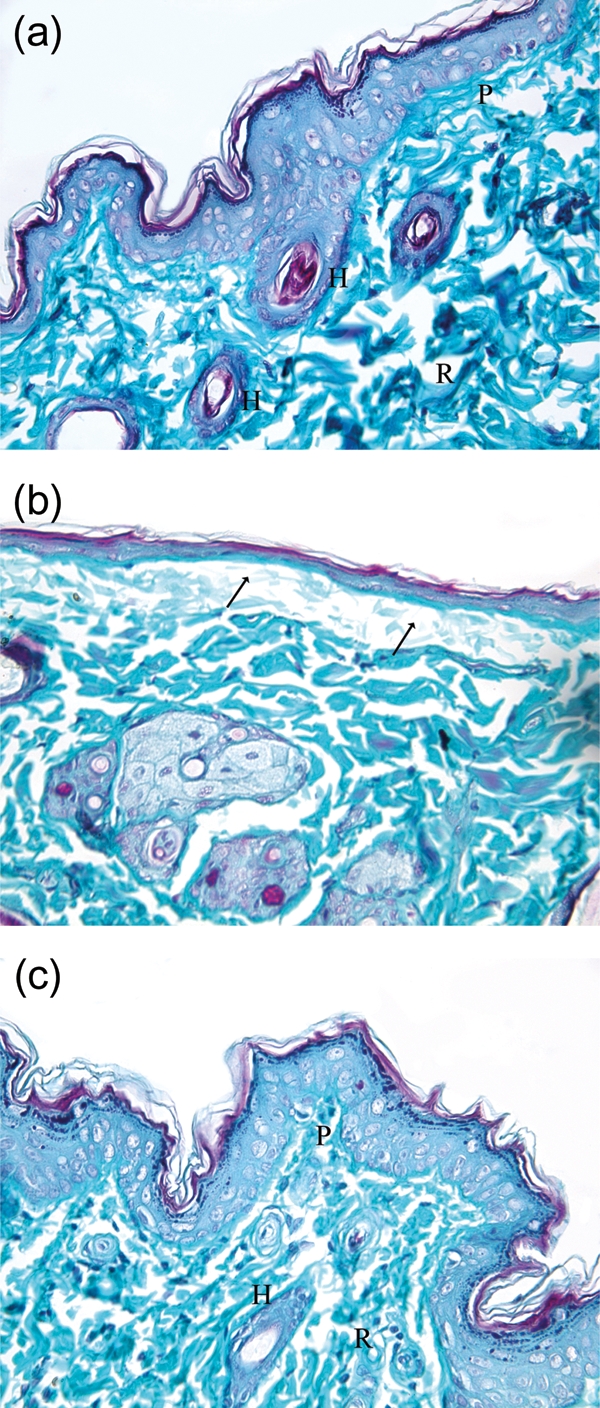
(a) Photomicrograph of a skin section from the control group showing normal appearance of dermal collagen fibres. The fibres are fine in the papillary layer (P) and coarse in the reticular layer (R) and around the hair follicles (H). (b) Photomicrograph of a skin section from the DC 2 week group showing marked decrease in collagen fibres under the ulcer area (arrow). (c) Photomicrograph of a skin section from the St 2 week group showing normal appearance of dermal collagen fibres. The fibres are fine in the papillary layer (P) and coarse in the reticular layer (R) and around the hair follicles (H). (Masson's trichrome ×400.)