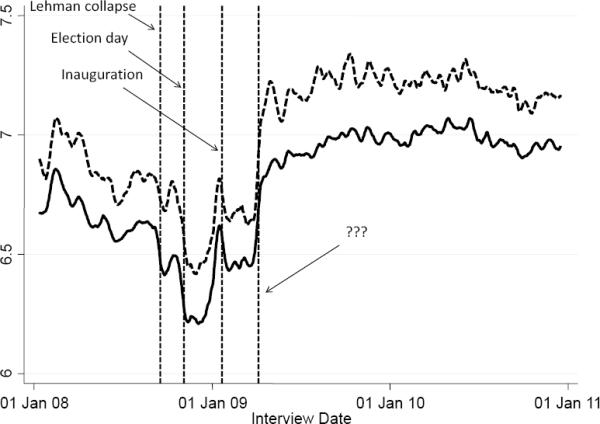
Figure 2. Mean ladder for general population and for over 60s.

Notes: The broken line is for the population aged 60 and above, the solid line for the whole population. The underlying data are daily averages, and the figure shows 21-day triangularly weighted moving averages
