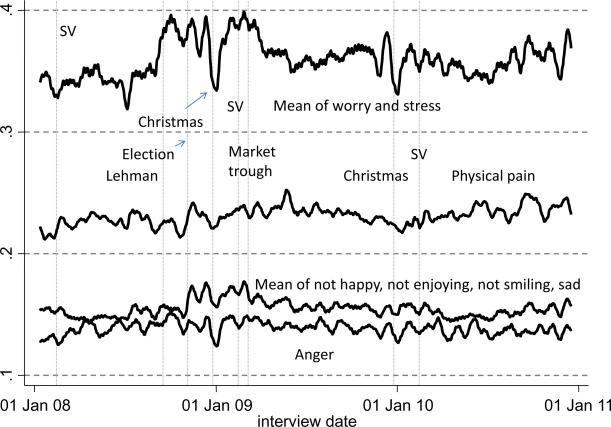
Figure 7. Negative hedonic experience, 2008 to 2010.
Notes: 21-day moving averages of underlying daily averages over the whole population. The top line is the averages of the fractions reporting worry or stress on the previous day. The second line is the fraction reporting physical pain on the previous day. The third line is the average of the fractions who reported sadness, or did not report happiness, enjoyment, or smiling on the previous day. The bottom line if the fraction of those reporting anger on the previous day. The vertical broken lines represent, from left to right, St Valentine's Day 2008, Lehman collapse, Election Day 2008, Christmas 2008, St Valentine's Day 2009, the market trough, Christmas 2009, and St Valentine's Day 2009.

