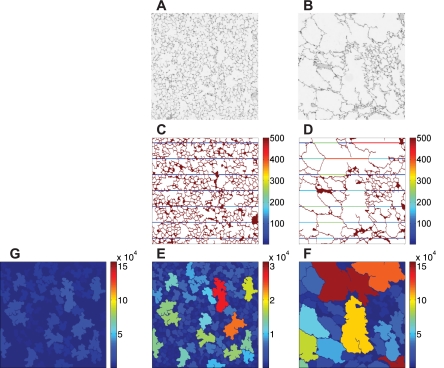
Fig. 1.
Histology sections and chord length (Lx) measurements from diseased animals (right) and normal animals (left). A and B: 1-mm2 histology sections from healthy (A) and diseased (B) mice. C and D: corresponding processed images with superimposed Lx values. The color bar is in units of μm. E–G: airspace areas. The color bars are in units of μm2. E is a rescaled image of G from a normal animal.

