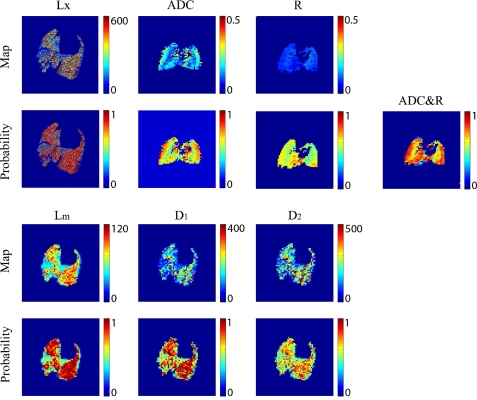
Fig. 10.
Plots of Lx, ADC, and R for animal 2 in the emphysema group as a function of position and the probability of disease based on these measurements are shown in the top and middle top rows. Plots of Lm, D1, and D2 and their respective probability maps are shown in the middle bottom and bottom rows. Lx, Lm, D1, and D2 color bars are in units of micrometers, whereas the ADC color bar is in units of cm2/s. R is dimensionless. Lx maps were enlarged slightly to better illustrate the fine structure.

