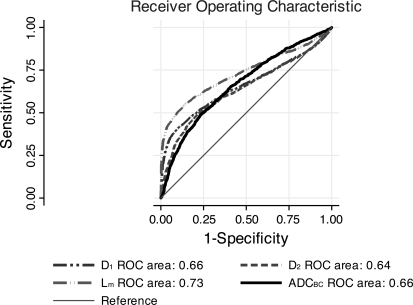
Fig. 8.
ROC curves for the classification algorithms based on the first ratio of equivalent airspace moments (D1), second ratio of equivalent airspace moments (D2), mean Lx (Lm), and ADCBC. D1: PD1(Disease) = {1 + exp[−(−1.15 + 0.02D1)]}−1; D2: PD2(Disease) = {1 + exp[−(−0.68 + 0.006D2)]}−1; Lm: PLm(Disease) = {1 + exp[−(−2.88 + 0.063Lm)]}−1, where P(Disease) is the probability of disease. The areas under the respective ROC curves are as shown.

