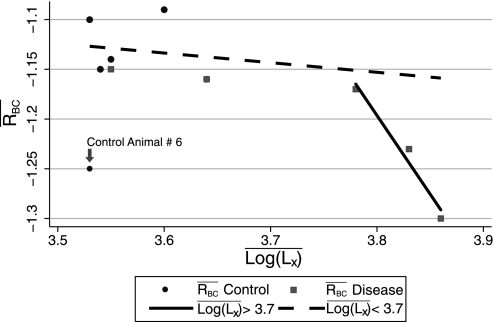
Fig. 9.
Scatterplot of mean RBC (R̄BC) versus mean log(Lx) [l̄og(Lx)]. Circles represent control animals, and squares represent emphysema animals. Regression lines calculated from the data above and below the cut point of 3.7 are depicted by the solid and dashed lines, respectively. Animal 6 in the control group was excluded from the regression line calculation.

