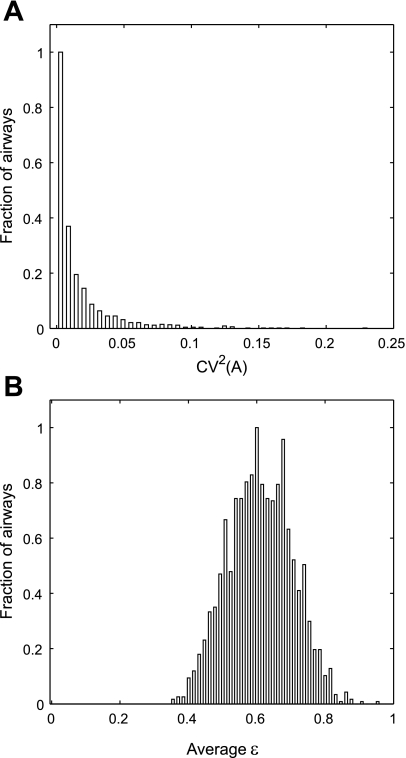
Fig. 5.
The distribution of the longitudinal heterogeneity in the cross-sectional area quantified by CV2(A) and the noncircularity of the shape of the airway cross section (ε). A: the distribution of CV2(A) in all airways of all subjects under 3 conditions. Skewness of this distribution was measured using statistical software, SAS, to be 3.24 with the median of 0.009. B: the distribution of eccentricity of the assumed elliptical cross section (ε). The average ε was 0.611.

