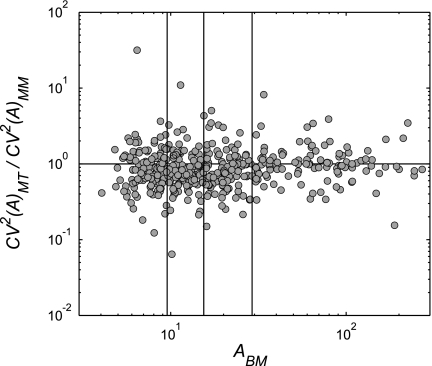
Fig. 8.
Changes in longitudinal heterogeneity in the cross-sectional area caused by the lung volume increase to TLC in airways of various sizes. The average luminal area of an airway at baseline (ABM) was plotted against the ratio in longitudinal heterogeneity in the CV2(A) at TLC over that at MLV of the same airway. The plot includes all airways of all subjects. ABM was imaged at MLV. MM, image taken after MCh challenge at MLV; MT, after MCh challenge at TLC. Airways with reduction in CV2(A) after the increase in lung volume to TLC would be below the unity line. Airways were binned into 4 quartiles with an equal number of airways (indicated by vertical lines). Note that in airways with the largest ABM the increase in lung volume to TLC did not significantly change the longitudinal heterogeneity.

