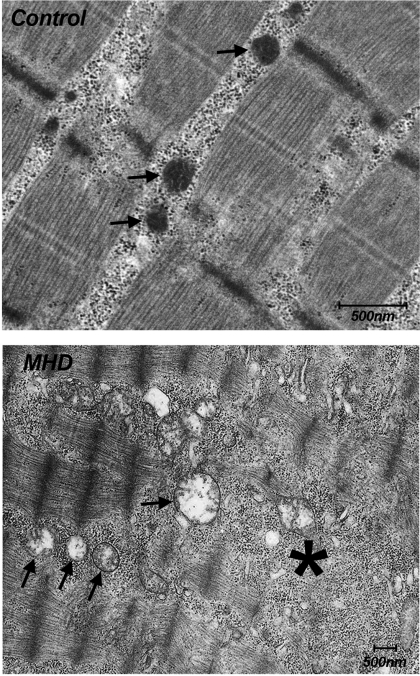
Fig. 4.
Representative ultrastructure of the vastus lateralis muscle from a healthy control subject (top) and from a MHD patient (bottom). Note a cluster of swollen mitochondria (arrows) and an area of Z-band disruption (*) with hemodialysis. Note difference in scale bars between control and MHD. Mitochondria (arrows) in controls are clearly seen at ×3 the magnification of MHD, and their average size is still smaller than or comparable with MHD.

