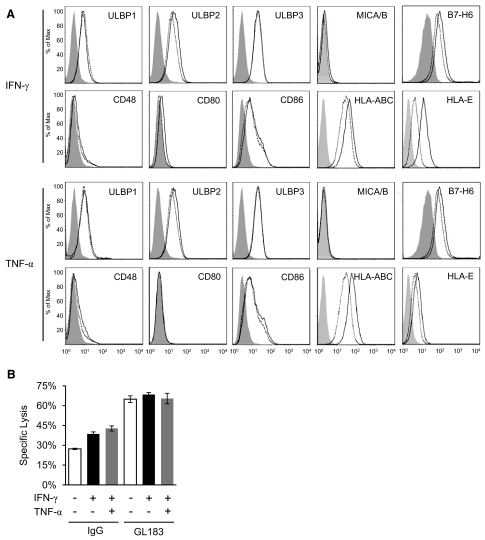
Figure 2. Change of NK ligands upon IFN-γ or TNF treatment.
(A) The expression of known ligands of activating NKRs and class I MHC molecules on THP-1 cells. Untreated (dotted lines), IFN-γ (50 ng/ml), or TNF-α (25 ng/ml) overnight-treated (black lines) THP-1 cells were stained with indicated antibodies and analyzed by flow cytometry. Isotype controls are shown in gray-shaded histograms. (B) Effect of inhibitory KIR on IFN-γ-induced lysis of THP-1. The cytotoxicity assays were carried out in the presence of a KIR-blocking antibody, GL183, or its isotype control using an E:T ratio of 8:1. The experiments were repeated for at least two times, and one representative result was shown.

