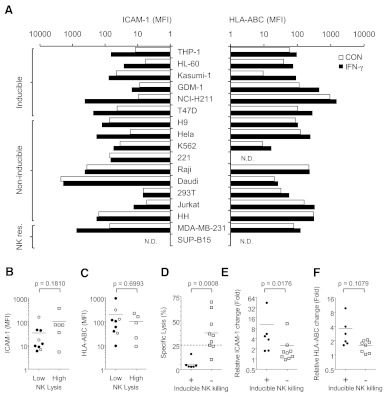
Figure 7. Distinct effects of IFN-γ on different tumor cell lines.
(A) Expression profiles of ICAM-1 and HLA-ABC on multiple tumor cell lines with or without IFN-γ treatment. NK res., NK resistance. (B) Comparison of basal levels of ICAM-1 on sensitive (high) and insensitive (low sensitivity) cytolytic target. (U=15.0; n1=9; n2=6; P=0.1810 two-tailed). (C) Comparison of basal levels of HLA-ABC on sensitive and insensitive cytolytic targets (U=19.0; n1=9; n2=5; P=0.6993 two-tailed). (D) Comparison of NK-mediated lysis of untreated-inducible and noninducible cells. The specific lysis of each target cell, based on the data from Fig. 6, at an E:T ratio of 1:1. The cutoff of sensitivity of NK lysis was shown as a dashed line. The distributions in the two groups differed significantly (U=1.0; n1=6; n2=9; P=0.0008 two-tailed). (E) Comparison of relative induction of ICAM-1 on inducible and noninducible cells. The distributions in the two groups differed significantly (U=7.0; n1=6; n2=9; P=0.0176 two-tailed). (F) Comparison of relative induction of HLA-ABC on inducible and noninducible cells (U=11.0; n1=6; n2=8; P=0.1079 two-tailed). The statistical analysis was done by Mann-Whitney U test using GraphPad Prism software. Inducible and noninducible target cells were shown as closed and open symbols, respectively.

