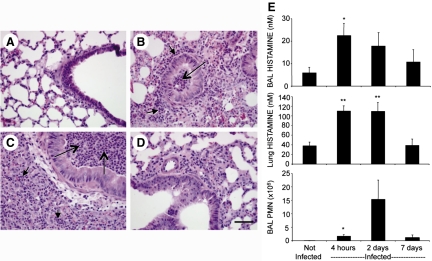
Figure 6. Correlations between neutrophilia and histamine concentration in PAO1 P. aeruginosa-infected lungs.
(A–D) Representative lung and airway histology in H&E-stained sections of uninfected (PBS-exposed) mice and mice 4 h, 2 days, and 7 days after infection with 5 × 10⁶ live PAO1 strain bacteria. All micrographs are at the same magnification. (D) Original scale bar is 50 μm. Examples of collections of neutrophils in airways and in alveoli or interstitium are identified by long and short arrows, respectively. (E) Graphs compare histamine and PMN concentrations at the same intervals after infection. Values represent mean ± se; n = 4–6 animals/group; *P < 0.05; **P < 0.01 compared with values observed in uninfected mice.

