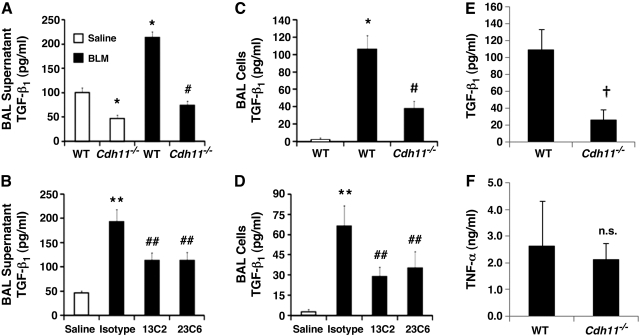
Figure 7.
CDH11 promotes TGF-β expression from alveolar macrophages. A–D) TGF-β levels were quantified in BAL supernatants (A, B) and protein lysates (C, D) from BAL cell pellets utilizing a standard TGF-β ELISA. Data are expressed as means ± se. Number of mice in each group is as reported in Figs. 2 and 3. E, F) In vitro TGF-β (E) and TNF-α (F) production from primary alveolar macrophages cultured from WT and Cdh11−/− mice. Results are means ± se from 3 independent experiments. n.s. = not statistically significant vs. WT. *P < 0.05, **P < 0.05 vs. WT or WT saline; #P < 0.05, ##P < 0.05 vs. WT bleomycin or bleomycin + isotype; †P < 0.05 vs. WT.

