
Figure 2.
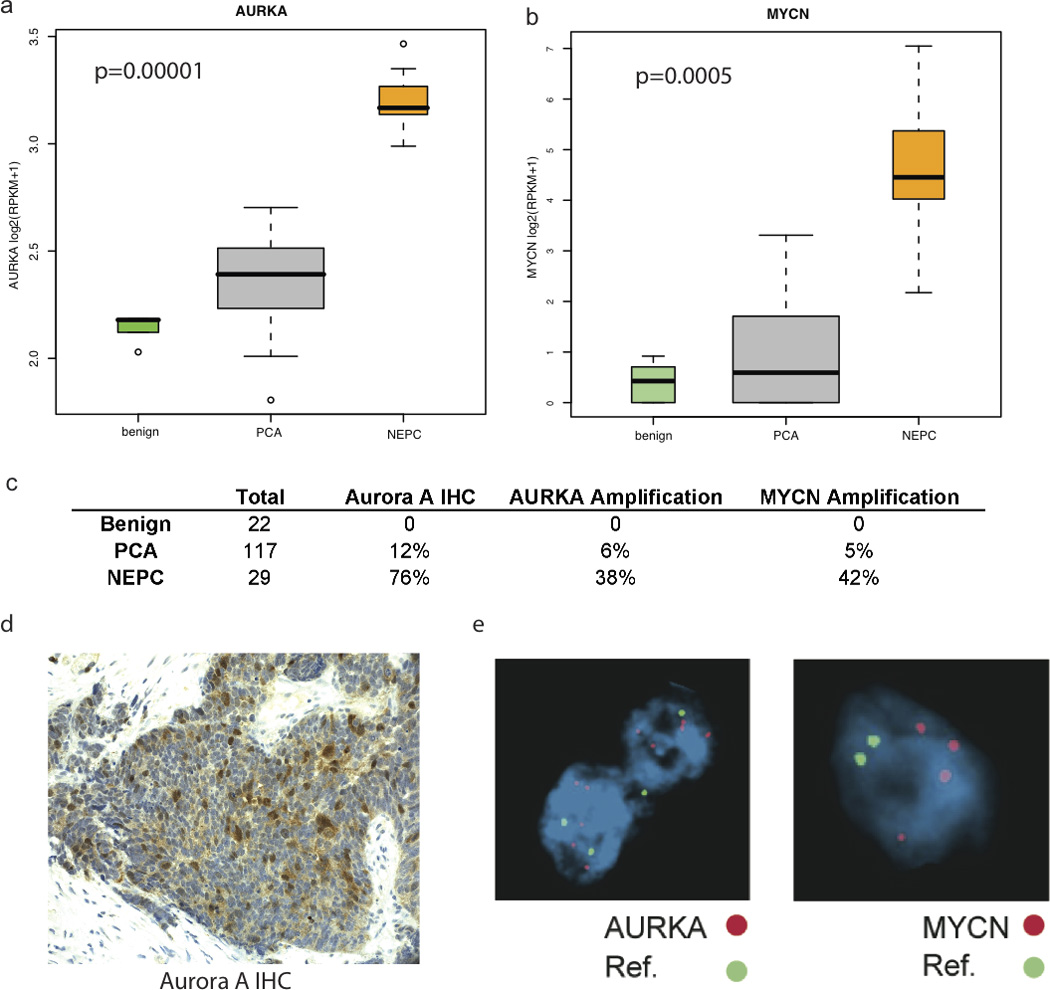
Evaluation of Aurora Kinase and N-Myc: (A) Gene expression of AURKA in Benign Prostate Tissue, PCA, and NEPC, as measured by RNA-Seq. RPKM= Reads per kilobase of exon per million mapped reads. (B) Gene expression of AURKA in Benign Prostate Tissue, PCA, and NEPC, as measured by RNA-Seq. RPKM= Reads per kilobase of exon per million mapped reads (C) Table summarizing IHC and FISH data from tumors from large cohort of PCA, NEPC, and benign prostate (D) Representative example of positive Aurora kinase A overexpression by IHC, and MYCN and AURKA amplification by FISH in human NEPC. Green= Centromeric Control Probes, Red = AURKA and MYCN loci as labeled in NEPC.