
Figure 3.
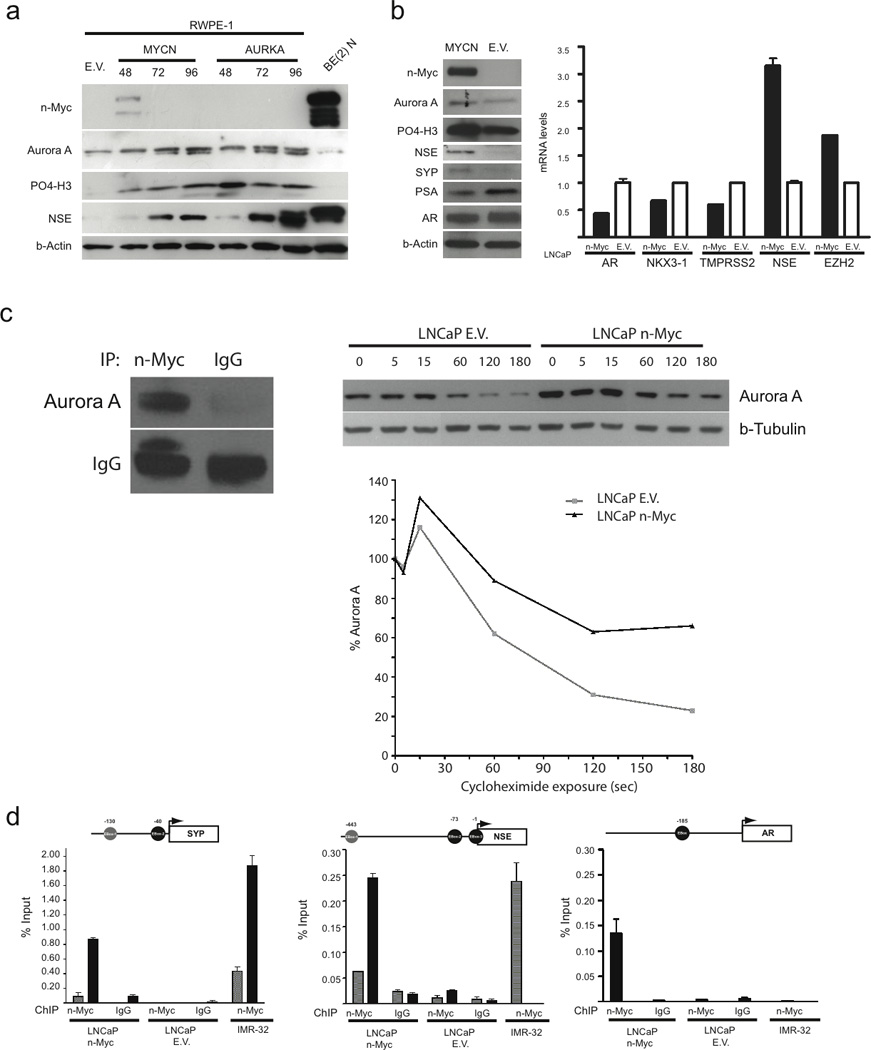
(A) Immunoblot analysis for protein expression of Aurora kinase A, Phosphorylated histone 3 (P04-H3), neuron specific enolase (NSE) and synaptophysin (SYP) after transient transfection of MYCN, AURKA, or Empty Vector (EV) in RWPE-1 cells. BE(2)N is a neuroblastoma cell line as positive control for NSE. (B) Stable LNCaP cell line over-expressing N-myc compared to empty vector (EV) : Immunoblot analysis for protein expression of N-myc, Aurora kinase A, P04-H3, NSE, SYP, PSA, AR, beta actin. qRT-PCR and microarray (MA) data showing induction of NSE (qRT-PCR) and EZH2 (MA) gene expression and suppression of AR (qRT-PCR) and androgen regulated genes (NKX3-1, TMPRSS2 (MA)) (C) Left: Immunoprecipitation of LNCaP-n-Myc cell lysates using antibodies directed against N-Myc or control IgG antibodies and Western blot using antibodies directed against Aurora kinase A (Aurora A) or control IgG antibodies. Right: LNCaP control (LNCaP E.V.) and LNCaP-n-Myc cells were treated with cycloheximide (CHX) for the indicated time (in minutes) and Aurora kinase A or beta-tubulin levels were assessed by immunoblotting. The normalized percent of Aurora kinase A relative to beta-tubulin and to time point 0 for LNCaP E.V. (gray line) or LNCaP-n-Myc (black line). (D) N-Myc directly binds to the SYP, NSE, and AR promoters in LNCaP-n-Myc cells and not LNCaP-EV. Not-to-scale schematic representation of SYP, NSE, and AR promoters showing the E-box sites (grey and black circles) indicated for each. The transcription start site for each gene is indicated with an arrow. Below each schematic are bar graphs showing the amount of enriched DNA (relative to input chromatin preparation) for each E-box site in the indicated cell lines following ChIP using either anti-N-Myc (right) or anti-IgG (left) antibodies. IMR-32 is a MYCN amplified neuroblastoma cell line. In IMR-32 cells, Nmyc binds promoters of SYP and NSE, but not AR.