
. 2011 Sep 22;19(20):19653–19659. doi: 10.1364/OE.19.019653
©2011 Optical Society of America
This is an open-access article distributed under the terms of the Creative Commons Attribution-Noncommercial-No Derivative Works 3.0 Unported License, which permits download and redistribution, provided that the original work is properly cited. This license restricts the article from being modified or used commercially.
Fig. 5.
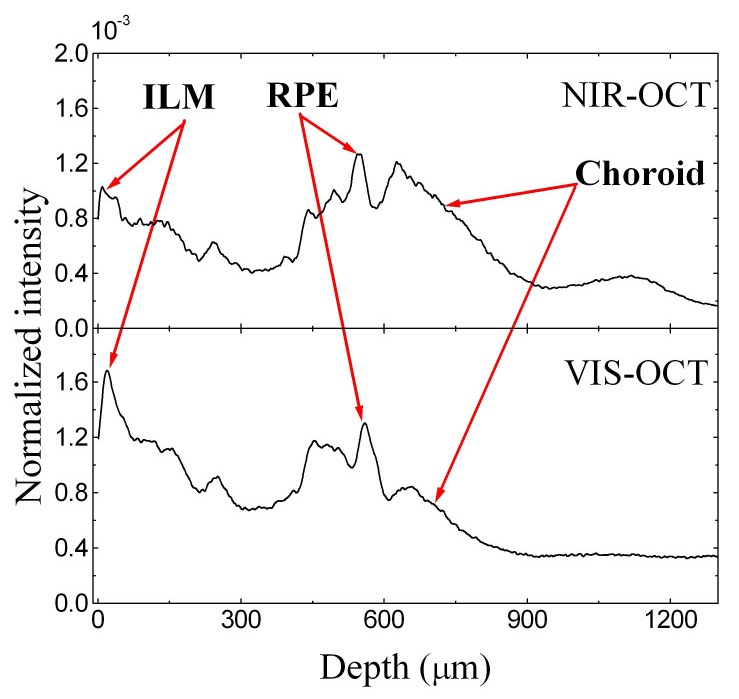
Normalized average of the A-lines of the OCT images in Fig. 4.