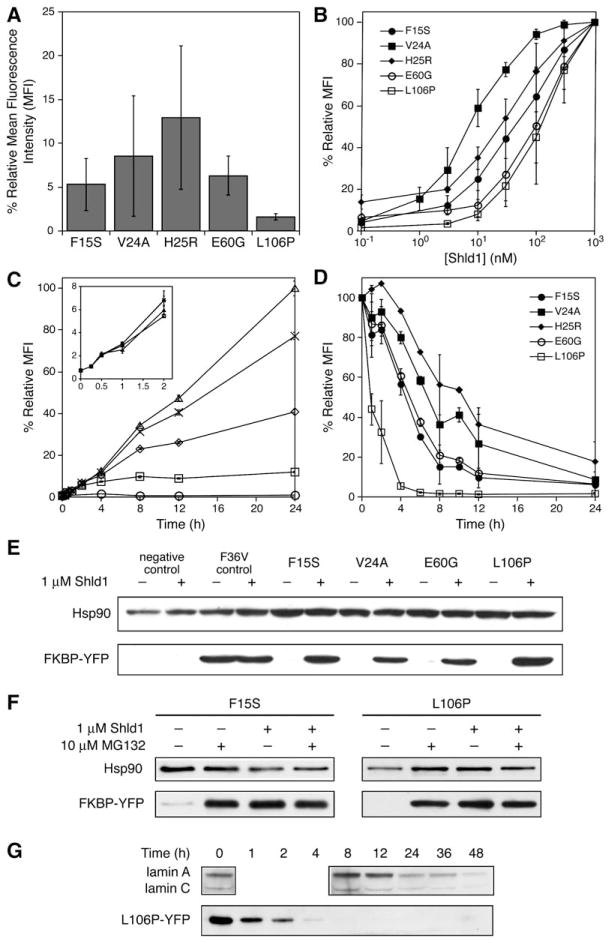
Figure 2. Characterization of FKBP Mutants that Display Shld1-Dependent Stability.
(A) Fluorescence of FKBP-YFP fusions expressed in NIH3T3 cells in the absence of Shld1 as determined by flow cytometry. (B) NIH3T3 cells stably expressing FKBP-YFP fusions were treated with 3-fold dilutions of Shld1 (1 μM to 0.1 nM) and monitored by flow cytometry. (C) NIH3T3 cells stably expressing FKBP-YFP fusions were either mock-treated (circles) or treated with 30 nM (squares), 100 nM (diamonds), 300 nM (crosses), or 1 μM (triangles) Shld1. Increases in fluorescence were monitored over time using flow cytometry. Mean fluorescence intensity (MFI) was normalized to 100% at 24 hr, 1 μM Shld1. (D) NIH3T3 cells stably expressing FKBP-YFP fusions were treated with 1 μM Shld1 for 24 hr, at which point the cells were washed with media to remove Shld1, and decreases in fluorescence were monitored using flow cytometry. Data for panels (A) through (D) are presented as the average MFI ± SEM relative to that of the maximum fluorescence intensity observed for the individual mutant. Experiments were performed in triplicate.
(E) FKBP-YFP fusions were either mock-treated or treated with 1 μM Shld1 for 24 hr and immunoblotted with an anti-FKBP antibody.
(F) NIH3T3 cells stably expressing F15S-YFP and L106P-YFP were treated with 1 μM Shld1 for 24 hr. Cells were then washed with media and treated with 10 μM MG132 in the presence or absence of 1 μM Shld1 for 4 hr. Immunoblotting was performed with an anti-YFP antibody.
(G) HeLa cells were transfected with siRNA against lamin A/C and monitored over time. Time required for knockdown of lamin A/C is compared against time required for degradation of L106P-YFP upon removal of Shld1 from NIH3T3 cells stably expressing the fusion.

