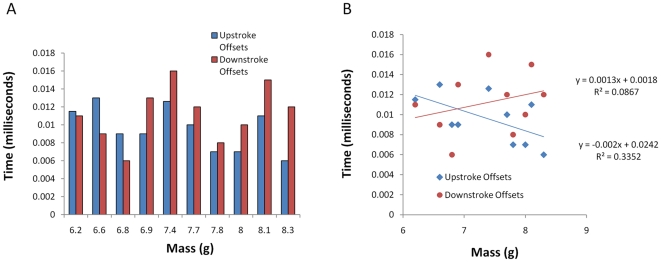
Figure 6. Change in oscillation offsets relative to body mass A.
Histogram showing extent of oscillation offsets between the left wing and tail tip during the upstroke (blue bars) and downstroke (red bars) for the little brown myotis (M. lucifugus), plotted against individuals that varied in body mass. B. Regression plot of the offset data shows the switch-over point of regression lines where downstroke offsets (red line) become more pronounced than upstroke offsets (blue line) in relation to body mass. Although neither regression line is statistically significant due to high variation in the sample, the consistent trend towards greater offsets occuring during downstrokes as body mass increases suggests meaningful shifting of kinematics with mass.

