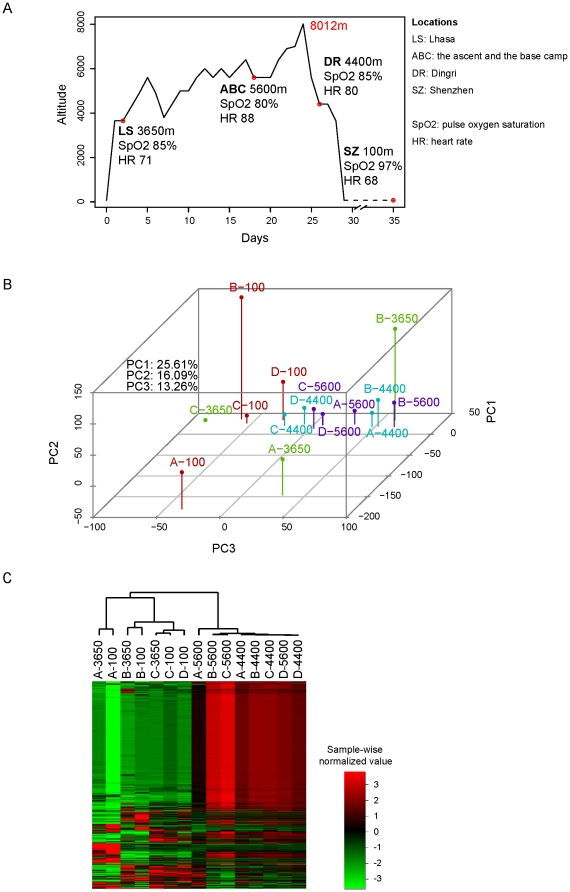
Figure 1. RNA expression pattern changes in samples from climbers at four different altitudes.
(A) Illustration of the climbing path and the sampling locations with average SpO2 and HR of four subjects. (B) PCA of all samples based on expression profiles of all genes measured by RNA-seq. The four colors represent the four different altitudes. (C) Hierarchical clustering of all samples based on expression profiles of all genes measured by RNA-seq. Samples are named in the format of ‘Climber ID-altitude’. The expression value for each gene is indicated by color intensity, with red representing high expression and green representing low expression.

