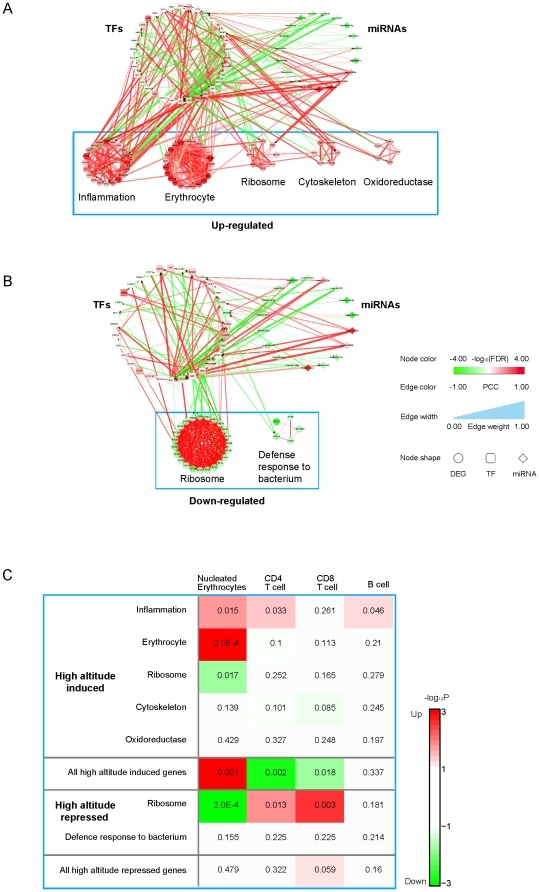
Figure 2. Modular network reponse to extreme altitude.
(A and B) The regulatory networks for up- (A) or down-regulated (B) gene expression at extreme altitude as compared to low altitudes illustrating the number of genes, gene density, function, regulations and structures of the modules and structures of the modular organization of the networks. TFs are visualized in the upper left circle, miRNAs in the upper right circle, and network modules in the up- or down-regulated altitude-responsive networks are each visualized as a circle. The color intensity of a node denotes the weight of the node, with red representing a positive weight value and up-regulation, and green representing a negative weight value and down-regulation. The width of an edge indicates the weight of the edge. The color of an edge indicates the expression correlation between the two genes connected by the edge. All other network graphs are similarly annotated except for the ResponseNet (Figure 3B). Graphic keys include node size, edge width, node and edge colors and shapes. (C) Expression level changes of up- and down-regulated network modules when differentiated hematopoietic cell lineages are compared to hematopoietic stem cells (HSCs).

