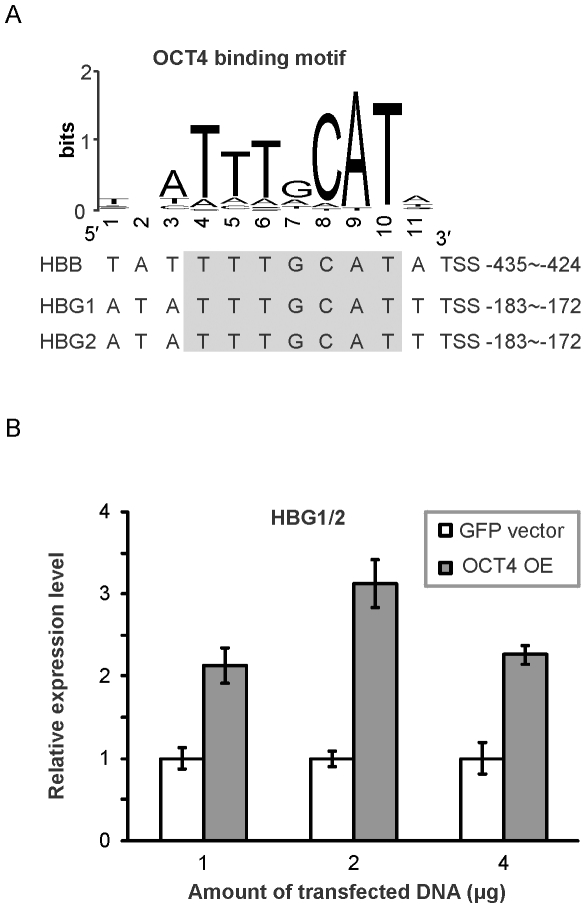
Figure 4. OCT4 binding sites and regulatoion of HBB, HBG1, and HBG2.
(A) The OCT4 binding motif logo shows the position weight matrix of the OCT4 in the TRANSFAC database. The predicted OCT4 binding sites on HBB, HBG1, and HBG2 are listed for comparison to the censensus motif. (B) Fold change of HBG1 and 2 (HBG1/2) mRNA expression level upon OCT4 overexpression. HeLa cells were transfected with 1, 2 and 4 µg of control GFP-containing vector or OCT4, each time three wells of cultured cells were measured separately by qPCR. Error bars represent standard deviations (marked by the wiskers). OE standands for overexpression.

