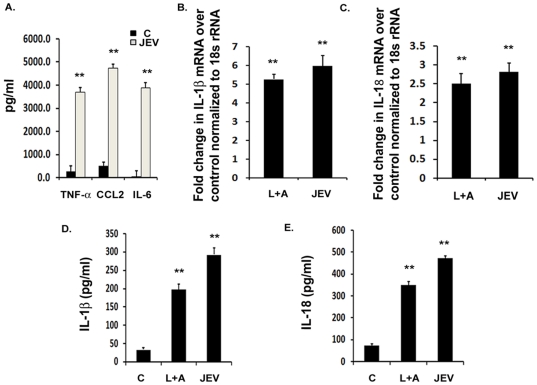
Figure 2. JEV induces the production of IL-1β and IL-18 in vitro.
BV-2 microglial cells were infected with 5 MOI of JEV for different time points. LPS+ATP condition was used as a positive control for qRT-PCR, ELISA and caspase-1 activity studies. (A) Cytokine analysis from mock-infected control and JEV infected BV-2 cells was carried out after 6 h of JEV infection using cytokine bead array. Graphs represent the levels of pro-inflammatory cytokines, TNF- α, CCL2 and IL-6 after JEV infection with respect to mock-infected control condition. (B–C) qRT-PCR studies on total RNA isolated from uninfected cells as well as on BV-2 cells infected with JEV for 3 h. IL-1β and IL-18 mRNA levels are represented in terms of fold change with respect to mock-infected control normalized to 18 s rRNA internal control. (D–E) Levels of mature IL-1β and IL-18 cytokines upon JEV infection with respect to mock-infected control condition were measured by ELISA. Graphs represent the fold change values in JEV infected cells with respect to mock-infected control condition. Data represent mean ± SEM from 3 independent experiments performed in duplicate. Statistical differences were evaluated using one way ANOVA with Bonferroni's post hoc test. *, **, Statistical differences in comparison to mock-infected control values (* p<0.05; ** p<0.01).

