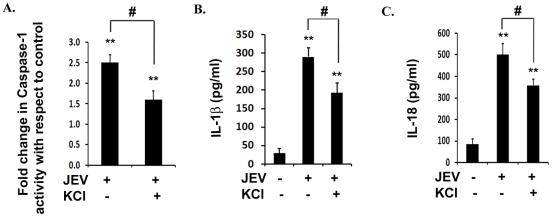
Figure 7. Potassium efflux is required for caspase-1 activity and subsequent inflammation upon JEV infection.
(A) Caspase-1 activity was measured in presence of KCl upon JEV infection. Graph represents caspase-1 activity in JEV infected cells incubated with KCl with respect to untreated JEV alone condition. (B–C) ELISA study showing the levels of IL-1β and IL-18 in KCl treated condition upon JEV infection over that of JEV alone condition. Graph represents IL-1β and IL-18 levels in pg/ml. Data represent mean ± SEM from 3 independent experiments performed in duplicate. Statistical differences were evaluated using one way ANOVA with Bonferroni's post hoc test. *, **, Statistical difference in comparison to mock-infected control values (*p<0.05, ** p<0.01) and #, Statistical difference with respect to JEV infected condition (p<0.01).

