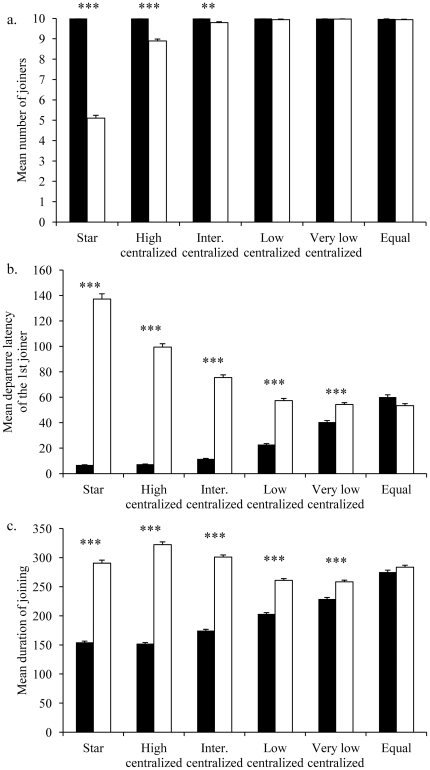
Figure 3. Comparison between the central individual and the non central individuals.
(a) Mean number of joiners, (b) mean departure latency of the first joiner, and (c) mean joining duration for each social network. Central individual is represented by the black bars, non central individuals are represented by the white bars.

