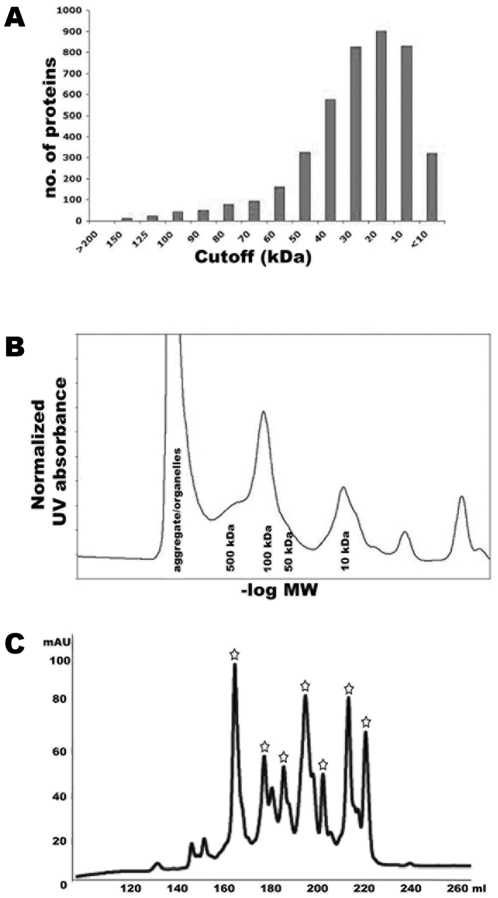
Figure 2. E. coli proteome predicted and experimental characterization.
(A) Predicted size distribution of all ORFs in the E. coli proteome. (B) Size exclusion chromatograph of crude E. coli lysate with the largest peak at approximately 100 kDa. (C) Final step ion exchange (MonoQ) purification in a typical fractionation experiment. Peaks marked with a star were sent for downstream crystallization trials.

