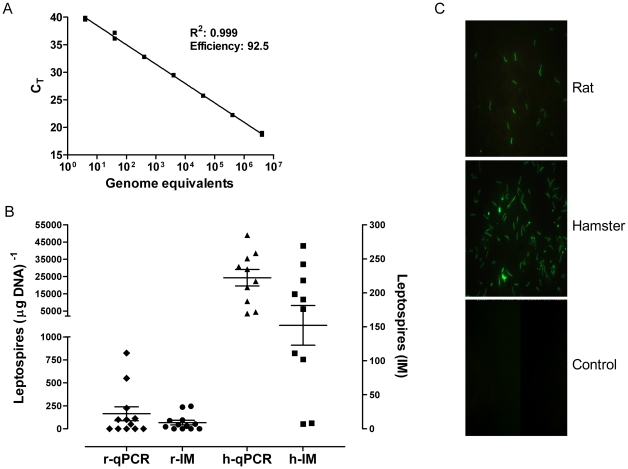
Figure 1. Quantification of leptospires by qPCR and the IM.
A. Standard curve of the lipL32 real-time PCR assay using DNA extracted from ten-fold serial dilutions of an L. interrogans strain Cop culture. Each DNA sample was quantified in duplicate and repeated twice. B. Quantification of the leptospiral load in the rat and hamster models. Rats were infected with 108 leptospires and were euthanized on day 28 pi. Hamsters were inoculated with 500 leptospires (3×LD50) and euthanized eight days pi. The leptospiral load in the kidneys was determined by qPCR (open symbols) and the IM (solid symbols). The leptospiral loads for the qPCR (leptospires per µg kidney DNA) and the IM (leptospires per 10 fields-of-view, ×1000 magnification) for the rat (r) and hamster (h) are presented as a scatter dot plot of the individual values for each animal, the horizontal line represents the mean value and the error bars the SEM. C. Representative examples of the imprint slides using kidney samples from an infected rat, a hamster and a non-infected control animal (magnification 1000×).

