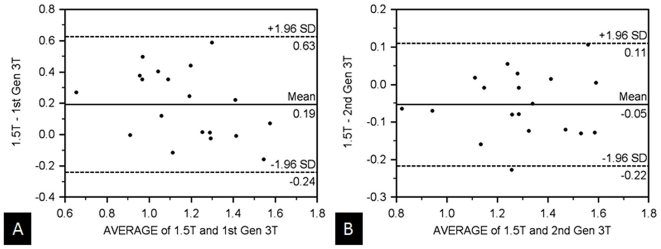
Figure 5. Comparison of pancreatic ADC-values between all three MR-scanners.
Bland-Altman plot of mean ADC values from the head of the pancreas comparing the 1.5 T system with the (a) first generation 3 T and (b) second generation 3 T scanners in voluteers. Mean ADC values of the first generation 3 T are on average 0.19×10⁻³ mm2/s lower than those measured on the 1.5 T system. Mean ADC values are similar in the 1.5 T and second generation 3 T scanners. (x-axis: average/y-axis: difference of ADC at 1.5 T and the corresponding 3 T systems (×10-3 mm3/s)).

