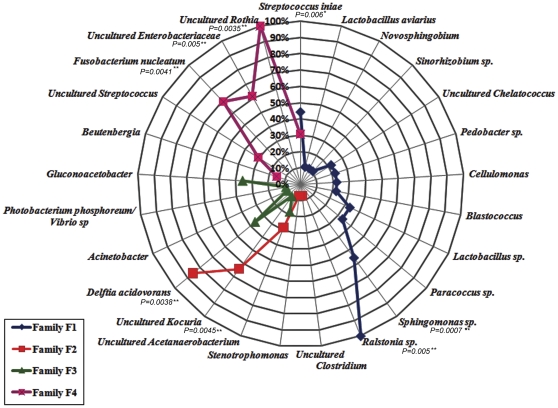
Figure 3. Prevalence of the different bacterial phylotypes identified in each rainbow trout family (F1, F2, F3 and 4).
Bacteria identified from a specific family are represented by the same color. Prevalence values (%) show the percentage of fish in a given family that harbored a specific bacterium. The association between the bacterial phylotype and a particular family was statistical assessed.* Indicates significant association (0.005<P<0.05), ** Indicates highly significant association (P<0.005).

