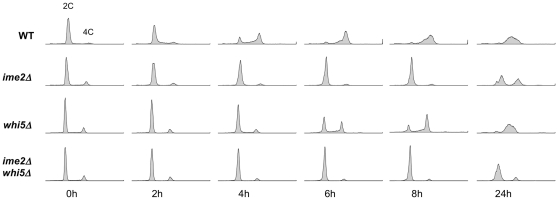
Figure 6. Epistasis analysis of IME2 and WHI5.
WT and mutant cells were induced to enter meiosis synchronously and DNA content was analyzed by flow cytometry at the indicated time points. This experiment was conducted in conjunction with the microarray experiment; therefore, sets of WT and ime2Δ histograms shown in Fig. 2 are reproduced here. Note that we have observed variability in the degree of DNA replication observed in ime2Δ cells at 24 h (e.g. compare with Fig. 1). Strains used were DSY1089, YGB221, YGB752, and YGB753.

