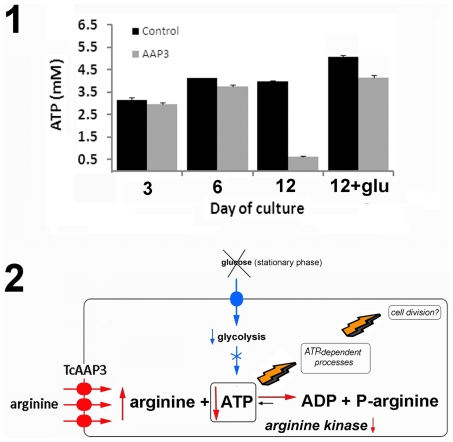
Figure 3. Regulation of arginine metabolism and ATP levels by TcAAP3.
1) Intracellular ATP concentrations were measured using a bioluminescence method and samples from different days of the parasite growth curve. Bars indicated as “12+glu” represent the ATP levels of parasites samples from day 12, cultured overnight in the presence of 2 g.L−1 glucose. 2) A brief summary of the arginine transport and metabolism regulation model at the stationary phase of epimastigote growth was constructed from the results herein presented.

