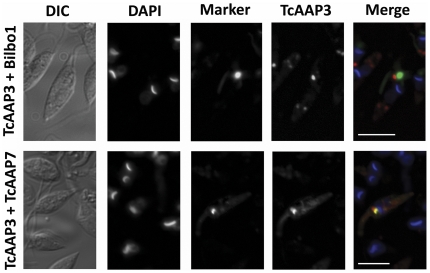
Figure 4. Subcellular localization of TcAAP3.
Parasites co-transfected with the pTREXL-mCherry::TcAAP3 and pTREXL-Bilbo1::eGFP (upper panels) or pTREXL-eGFP::TcAAP7 (lower panels) were analyzed by fluorescence microscopy, 24 h post-transfection. Differential interference contrast (DIC), DAPI, eGFP (Marker), mCherry (TcAAP3) and the merged image (Merge) are showed in the indicated columns. White bars in the left corner of the merged images represent 5 µm.

