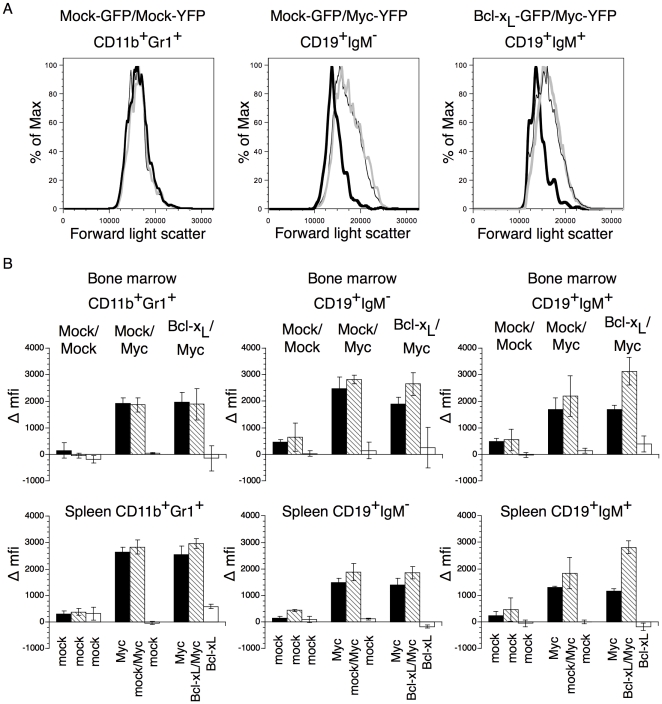
Figure 7. Blast formation of Mock-GFP/Mock-YFP, Mock-GFP/MYC-YFP or BCL-XL-GFP/MYC-YFP bone marrow and spleen cells.
(A) Forward light scatter of CD11b+Gr1+ bone marrow cells from Mock-GFP/Mock-YFP, Mock-GFP/MYC-YFP and BCL-XL-GFP/MYC-YFP recipient mice 2 weeks after transplantation. Grey thick lines indicate GFP−YFP+ cells, thick black lines indicate GFP+YFP− cells and thin lines indicate GFP+YFP+ cells. (B) Difference in mean fluorescence intensity (Δmfi) in forward scatter of CD11b+Gr1+ (left), CD19+IgM− (middle) and CD19+IgM+ (right) cells in bone marrow (top) and spleen (bottom) between GFP−YFP− (non-transduced cells) and GFP−YFP+ (black bars), GFP+YFP+ (striped bars) or GFP+YFP− (white bars) cells are shown. Values indicate means of three individual mice and error bars indicate 1 SD.

